Math Functions in Plain Steps: Linear vs Quadratic Functions Side by Side
When students first meet math functions, two families stand out: linear and quadratic functions. They look different, behave differently, and model different kinds of change. This guide walks through each one in plain steps, then places them side by side so you can spot patterns, avoid common mix-ups, and apply them with confidence.
What a linear function is
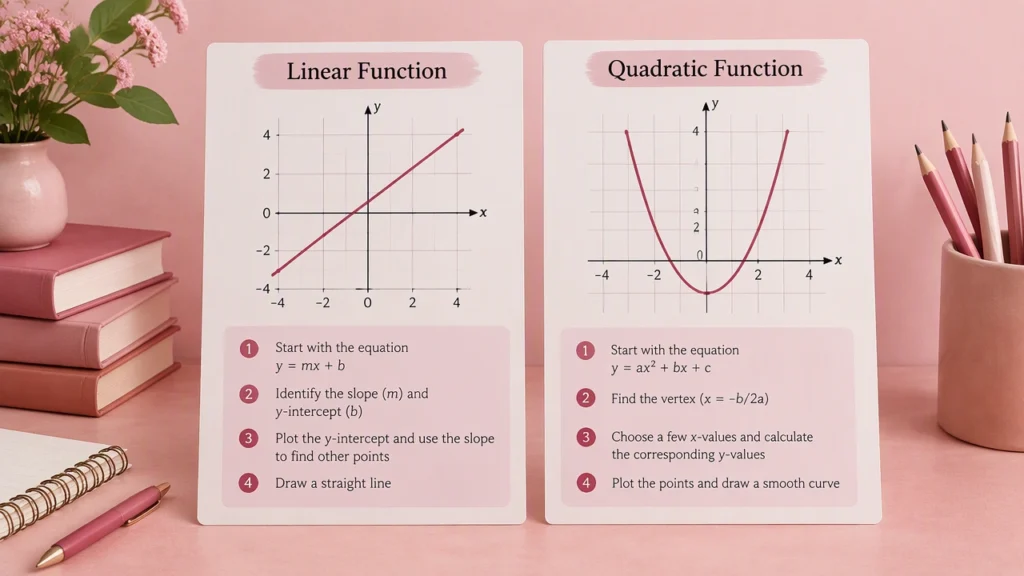
A linear function forms a straight line when graphed. Its standard form is f(x) = mx + b, where m is the slope and b is the y-intercept. The slope tells you how much the output changes when the input increases by 1. The y-intercept tells you where the line crosses the vertical axis.
Because the rate of change is constant, linear functions are great for situations where equal steps in the input produce equal steps in the output. Examples include a steady hourly wage, a constant speed, or a predictable subscription fee.
Key features to notice
- Slope (m): Positive slope means the line rises from left to right; negative slope means it falls.
- Y-intercept (b): The starting value when x equals 0.
- Constant rate of change: The output changes by the same amount for every 1-unit increase in x.
- Graph shape: A straight line with no curves.
What a quadratic function is
A quadratic function forms a curve called a parabola. Its standard form is f(x) = ax^2 + bx + c, where a, b, and c are constants and a is not zero. The squared term is what gives the function its curve and changes how the output grows as x increases.
Quadratic functions appear whenever change itself is changing. For example, the height of a tossed ball over time, the area of a square as its side length grows, and the path of a fountain stream all follow quadratic patterns.
Key features to notice
- Vertex: The highest or lowest point on the parabola.
- Axis of symmetry: A vertical line through the vertex that splits the parabola into mirror halves.
- Direction: If a > 0, the parabola opens upward; if a < 0, it opens downward.
- Roots or x-intercepts: The input values that make f(x) = 0, if they exist.
- Y-intercept: The point where x = 0, which is c in standard form.
Side-by-side comparison
Here is the difference between linear and quadratic functions explained in a compact way:
- Equation form: Linear is f(x) = mx + b; quadratic is f(x) = ax^2 + bx + c.
- Highest power of x: Linear uses x to the first power; quadratic uses x to the second power.
- Graph shape: Linear is a straight line; quadratic is a parabola.
- Rate of change: Linear has a constant rate; quadratic has a changing rate.
- Vertex: Linear functions do not have a vertex; quadratic functions do.
- Symmetry: Linear functions are not symmetric about a vertical line; quadratic functions are symmetric about their axis of symmetry.
- Number of x-intercepts: A non-horizontal line crosses the x-axis once; a parabola can cross zero, one, or two times.
- Typical real models: Linear models steady growth or cost; quadratic models acceleration, area, and projectile motion.
How their graphs behave
On a coordinate plane, a linear function keeps the same steepness everywhere. If you move right 1 unit, the output always changes by m units. A quadratic function does not keep the same steepness. Near the vertex, the curve is gentle. Farther from the vertex, the curve becomes steeper because the squared term grows faster than a simple multiple of x.
Another helpful visual cue is curvature. A straight line has no curvature. A parabola has constant curvature direction: it either bends upward or downward the whole way. That bending is why the vertex is a turning point.
Intercepts and solutions
For a linear function f(x) = mx + b, the x-intercept is found by solving mx + b = 0. Unless m = 0, there is exactly one solution. For a quadratic function, the x-intercepts come from solving ax^2 + bx + c = 0. Depending on the discriminant b^2 − 4ac, there can be two real solutions, one repeated real solution, or no real solutions. This is one of the clearest structural differences: linear equations typically have one root, while quadratic equations can have up to two real roots.
Rate of change in action
Linear functions have a constant rate of change. If the slope is 3, every 1-unit step in x raises the output by 3 units. Quadratic functions have a changing rate of change. The slope of the tangent line to the curve gets steeper as you move away from the vertex. That is why quadratic growth can look slow at first and then accelerate quickly.
This distinction matters in decision-making. If a cost rises linearly, you can predict future costs with simple multiplication. If a cost rises quadratically, doubling the input might more than double the output, so planning needs extra care.
Real-world uses
Linear function examples
- Wages and billing: A flat hourly rate produces a straight-line total as hours increase.
- Distance at constant speed: Distance equals speed times time when speed is constant.
- Simple depreciation: A fixed annual reduction in value forms a linear model.
- Scaling recipes: Doubling ingredients doubles the yield in a straight-line way.
Quadratic function examples
- Projectile motion: The height of a ball over time follows a parabola due to gravity.
- Area problems: The area of a square or rectangle with linked sides grows with the square of a dimension.
- Revenue optimization: When price and quantity interact, revenue can follow a quadratic curve with a maximum.
- Braking distance: Stopping distance often grows roughly with the square of speed under simplified assumptions.
How to choose the right model
Start by asking two questions. First, does the output change by equal amounts for equal steps in the input? If yes, a linear model is a strong candidate. Second, does the output growth speed up or slow down as the input increases? If yes, consider a quadratic model. Checking a small table of values often reveals the pattern quickly. If the first differences are constant, the data fits a linear pattern. If the second differences are constant, the data fits a quadratic pattern.
Common mistakes to avoid
- Assuming every curve is quadratic: Some curves come from other families, so test the pattern before choosing a model.
- Ignoring units: A slope in a linear model has clear units per unit. In a quadratic model, the meaning of a, b, and c depends on the context.
- Forgetting the vertex: The vertex tells you the maximum or minimum, which is often the most important point in applications.
- Overfitting with extra terms: Keep the model as simple as the data requires.
Key takeaways
Linear functions model constant change with straight-line graphs. Quadratic functions model changing rates with parabolic graphs. Each family has its own equation form, features, and best-fit applications. By comparing slope and curvature, intercepts and vertices, and constant versus accelerating growth, you can decide which function family fits a problem and then use its structure to make accurate predictions.