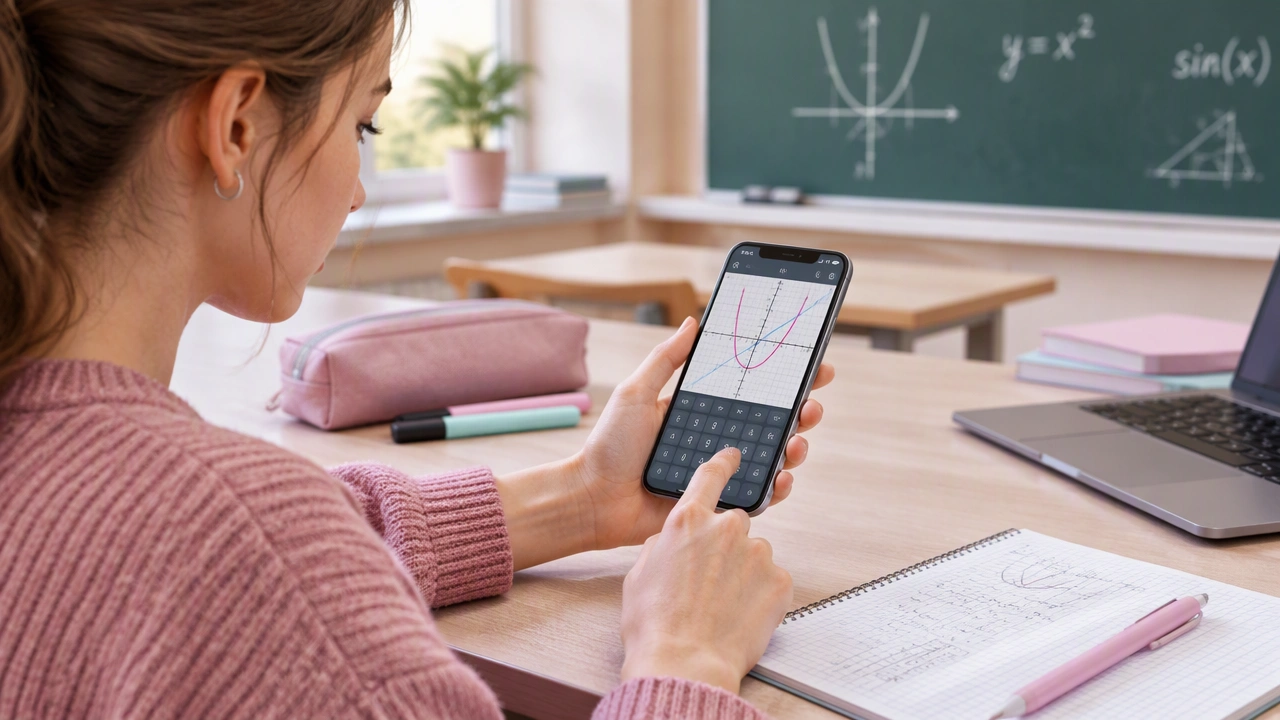
Best Free Graphing Calculator Apps Compared on Real Classroom Tasks

Finding the best free graphing calculator apps for learning functions is less about flashy menus and more about whether an app helps a student move from an equation to a clear, useful graph without getting stuck. This comparison looks at popular free options through the lens of real classroom tasks: plotting a line, comparing two functions, adjusting a slider, checking a solution, and explaining a result.
What the classroom tasks reveal
Each app was considered against the same set of tasks that appear in algebra, precalculus, and introductory calculus work. The goal was not to rank features in the abstract, but to see how quickly a student can complete a task, understand the output, and continue thinking about the underlying math functions.
- Plot a linear function: enter a rule such as y = 2x + 3 and display a readable graph.
- Compare two functions: graph y = x^2 and y = 2x – 1 on the same axes and identify intersections.
- Adjust parameters: change a slope or intercept and watch the graph respond.
- Inspect a point: find a coordinate, a zero, or an intersection with reasonable precision.
- Explain the result: leave a graph clear enough to include in homework or a class discussion.
Desmos: fast entry and clear classroom visuals
Desmos remains one of the most approachable choices for students who need to move quickly from an expression to a graph. Typing an equation is straightforward, and the graph updates immediately. Multiple functions can be colored and compared without a crowded legend. Sliders are especially useful: a student can turn a parameter such as m in y = mx + b into a movable value and see which part of the graph changes.
On the core tasks, Desmos is strong at graphing, comparing, and inspecting points. Its interface is clean enough for a first-time user, yet detailed enough for lessons that involve transformations, systems, or piecewise behavior. A practical limitation is that some advanced calculations depend on features that may be outside the free experience, so students should confirm that a required tool is available before relying on it for a project.
GeoGebra: a broader workspace for exploration
GeoGebra combines graphing with geometry tools, sliders, and constructions. That makes it useful when a lesson connects an equation to a shape, a transformation, or a dynamic model. Entering a function is still simple, and the extra tools can help a student test an idea rather than just view a finished picture.
The trade-off is complexity. A new user may need a few minutes to learn where the graphing controls, input bar, and view settings live. For a quick homework check, that can feel like more interface than needed. For a project that asks students to manipulate a model or connect algebra with geometry, the same breadth becomes an advantage.
Graphing Calculator apps built into mobile platforms
Many students first open the graphing tool already installed on a phone or tablet. These apps are convenient because they are immediately available and usually support the basic tasks: enter a function, set a window, trace a point, and zoom. They are a sensible choice when a student needs a quick visual check during class.
Their limits appear when the work becomes more interpretive. Adjusting a window manually can hide an important feature, and tracing may give a coordinate that looks precise without explaining how it was found. Students should use these apps as quick sketching tools, then check important results with a method that shows the steps.
Wolfram Alpha: strong for symbolic answers, different for graphing
Wolfram Alpha is often useful when a student needs more than a picture: solving an equation, simplifying an expression, or requesting a step-by-step explanation. It can produce a graph as part of an answer, which is helpful for checking whether a symbolic result makes sense.
As a graphing workspace, however, it is less fluid than an app designed for repeated plotting. Changing a parameter usually means entering a new query rather than dragging a slider. That makes it a good companion for verification, but a less natural place for exploratory graphing.
How the apps compare on real tasks
Graphing and comparing functions
For entering several functions and seeing their relationship, Desmos offers the smoothest first experience. GeoGebra provides more room for construction and dynamic adjustment. Mobile built-in tools handle simple comparisons but may require more manual window work.
Understanding transformations
Sliders make transformations visible in real time. Desmos and GeoGebra both support this kind of exploration well, though GeoGebra adds tools for connecting the graph to geometric ideas. A student who changes a coefficient and watches a line rotate or a parabola widen is more likely to explain the change than one who only reads a static image.
Checking work
Wolfram Alpha is helpful for symbolic verification, while graphing apps are better for seeing behavior across a domain. The most reliable study routine combines both: use a graph to form an intuition, then use an algebraic or numerical check to confirm the result.
Which free app should a student choose?
For everyday algebra and precalculus, Desmos is a strong default because it is quick, readable, and easy to share. For lessons that blend graphs, geometry, and dynamic models, GeoGebra is worth the extra setup. For a fast check on a phone, the built-in graphing tool is often enough. For symbolic solving and explanations, Wolfram Alpha works best as a supporting tool rather than the main graphing workspace.
The right choice also depends on the classroom. If a teacher asks students to submit screenshots, a clean graph with labeled axes matters. If the task is to describe how a parameter affects a function, a slider matters more. If the assignment requires showing algebraic steps, a graphing app should support the explanation, not replace it.
A simple workflow for studying functions
Start by writing the function in plain form and identifying what each part controls. Graph it with a sensible window and label any important points. Add a second function when comparison is the goal. Change one parameter at a time and describe the effect in a sentence. Finally, verify intersections, zeros, or solutions with an independent calculation.
This workflow turns a graphing app into a thinking tool. The best free graphing calculator apps are the ones that make each step visible, keep the interface out of the way, and leave students with a result they can explain in their own words.